

How We Test VPN Speeds: Our Methodology, Tools, and What the Numbers Really Mean
Ever wondered how we arrive at the speed numbers in our VPN reviews? Here’s the full, transparent breakdown of our testing methodology, tools, and the limitations of any speed test.
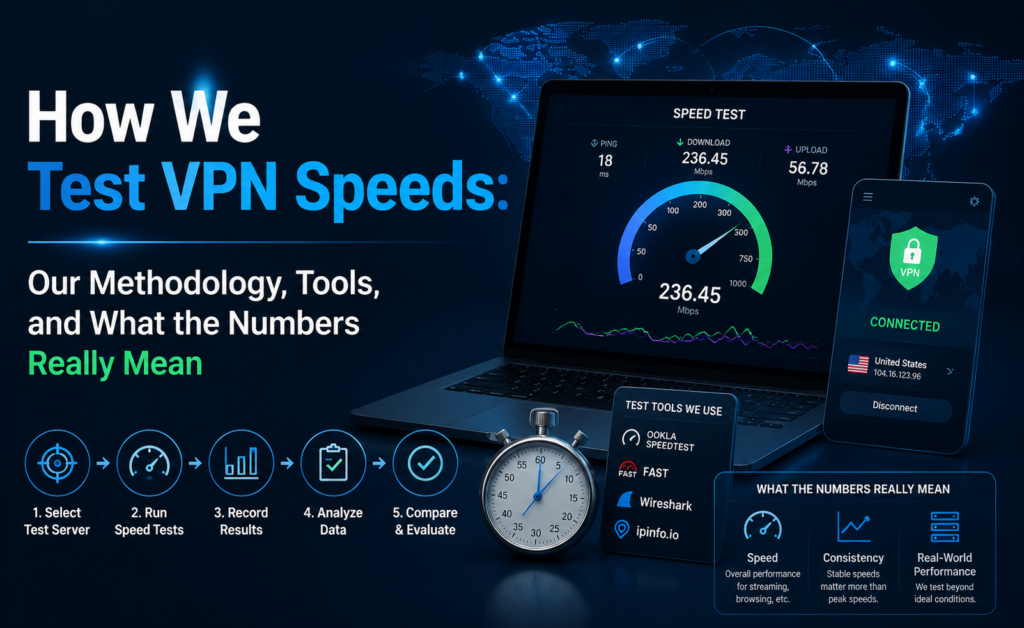
How We Test VPN Speeds: Our Methodology, Tools, and What the Numbers Really Mean
Transparency matters as much as the numbers themselves. We’re often asked exactly how Tedony arrives at the speed figures published across our reviews, so we’re pulling back the curtain entirely. This article walks through our full testing methodology, the tools we rely on, the safeguards we use against misleading one-off results, and — just as important — what our numbers don’t tell you.
Why Methodology Transparency Matters
VPN speed claims are notoriously easy to game. A single test run during a quiet off-peak hour, on a nearly empty server, over a short distance, will produce a flattering number for nearly any provider. That’s exactly why we don’t publish single-run results, and why we think any review site that does deserves healthy skepticism from readers.
Step One: Establishing a Clean Baseline
Before touching any VPN, we measure our raw connection speed using multiple tools (Ookla Speedtest CLI, a fixed-endpoint file download, and a secondary independent speed test service) to confirm the baseline is stable and not itself experiencing an anomaly. We repeat this baseline measurement before and after each testing session to catch any drift in our own underlying connection that could otherwise be misattributed to the VPN.
Step Two: Multi-Location Server Testing
We don’t test a single server and extrapolate. Every provider is tested across a minimum of three distance tiers:
- Local: A server in the same country as our test location.
- Regional: A server roughly 1,000–2,000 km away.
- Long-haul: A server on a different continent, typically over 8,000 km away.
This tiered approach reflects how real users actually use VPNs — sometimes for a nearby privacy-focused connection, sometimes to reach content or services in a specific distant region.
Step Three: Time-of-Day Sampling
Network congestion varies enormously by time of day. We run each test at three distinct windows — early morning, midday, and peak evening hours — and require at least five completed runs per window per server before we calculate an average. Any run affected by an obvious anomaly (a background update, an unrelated network interruption) is discarded and re-run rather than included in the average.
Step Four: Protocol Consistency
Wherever a provider offers multiple protocols, we test using whichever is set as the app’s default for most users, since that reflects the actual experience the vast majority of subscribers will have. We separately test protocol-by-protocol comparisons (see our dedicated WireGuard vs OpenVPN vs Lightway breakdown) when isolating protocol as a variable specifically.
Step Five: Real Application Testing, Not Just Synthetic Benchmarks
Synthetic speed test tools are useful, but they don’t always mirror real usage. Alongside our Speedtest CLI numbers, we run practical tests: streaming a 45-minute 4K session, downloading a large multi-gigabyte file from a fixed source, and conducting a video call, logging buffering events, download completion time, and call quality throughout.
How We Calculate “Percent of Baseline”
Rather than publishing raw megabit numbers — which are meaningless without knowing the tester’s own connection speed — we calculate what percentage of the pre-VPN baseline speed was retained through the tunnel. This normalizes results across different testing sessions and makes cross-provider comparisons far more meaningful than raw numbers alone, which can vary wildly simply based on the tester’s home internet plan.
What Our Numbers Cannot Tell You
We believe strongly in stating the limits of our own data:
- Your ISP is different from ours. Peering arrangements between your specific ISP and a VPN provider’s network can meaningfully affect your results in ways our testing location can’t replicate.
- Server load changes constantly. A server that was lightly loaded during our test window may be congested during yours, and vice versa.
- Our results are a snapshot. VPN providers update infrastructure regularly; results from three months ago may not reflect current performance, which is why we re-run our benchmarks on a rolling basis rather than publishing once and leaving figures untouched indefinitely.
- Device and hardware differences matter. Older routers, outdated Wi-Fi standards, and underpowered devices can bottleneck a connection well before the VPN itself becomes the limiting factor.
Common Pitfalls We Actively Avoid
A few practices we’ve deliberately excluded from our methodology because they tend to produce misleading results:
- Single-run testing. One test on one server at one time of day tells you almost nothing reliable.
- Testing only nearby servers. This flatters every provider equally and hides real-world differences that emerge over distance.
- Ignoring time-of-day variance. A midday-only test misses the peak-hour congestion that matters most to typical evening users.
- Relying solely on synthetic benchmarks. Numbers alone don’t capture the buffering, stutter, and lag that actually affects user experience.
Tools We Use, In Detail
| Tool | Purpose |
|---|---|
| Ookla Speedtest CLI | Primary download/upload/ping benchmarking, scriptable for repeated automated runs |
| Fixed-endpoint CDN download | Large single-file download to measure sustained throughput independent of Speedtest server selection quirks |
| Custom multi-threaded script | Simulates real-world parallel connections (e.g., multiple browser tabs and background downloads) |
| Streaming platform playback logging | Tracks buffering events, resolution changes, and start-up latency during real content playback |
| Ping/jitter monitoring tool | Continuous latency and jitter tracking for gaming and video-call relevant metrics |
How Often We Re-Test
VPN infrastructure isn’t static — providers add servers, retire old ones, and adjust routing regularly. We aim to refresh our core benchmark data on a rolling quarterly basis at minimum, with more frequent spot-checks whenever a provider announces a major infrastructure or protocol change.
A Sample of Our Raw Data Approach
To illustrate how a single provider’s results actually look before we average them into a headline figure, here’s a simplified example of what a regional-server test round might resemble across our required minimum of five runs per time window:
| Run | Time Window | % of Baseline Retained |
|---|---|---|
| 1 | Early Morning | 91% |
| 2 | Early Morning | 89% |
| 3 | Midday | 85% |
| 4 | Midday | 87% |
| 5 | Peak Evening | 74% |
| 6 | Peak Evening | 71% |
Notice the clear downward trend from morning to evening — this is exactly the kind of pattern that a single-run test would completely miss, and exactly why we insist on multiple runs across multiple time windows before publishing any average. A review based only on run 1 would paint a far rosier picture than a review based only on run 6, even though both are measuring the very same provider and server.
Independent Verification and Reader-Submitted Data
We don’t consider our own lab results the final word. Wherever possible, we cross-reference our findings against independent, publicly available network performance reports and aggregate anonymized feedback submitted by our own readers about their real-world experience with specific providers and servers. When our lab data and reader-submitted patterns diverge significantly, that’s a signal to us that regional or ISP-specific factors may be at play that our single test location can’t fully capture, and we try to note that explicitly in our reviews rather than presenting a single number as universally applicable.
This is also why we actively encourage readers to treat our published figures as a well-tested starting point rather than a personal guarantee, and why we repeat, in nearly every review we publish, that testing a provider yourself during its trial or refund window remains the single most reliable way to know how it will perform on your specific connection.
Frequently Asked Questions
Do you disclose which specific servers you tested?
Where practical, we note the general region and distance tier tested, since exact server names can change frequently as providers add and retire infrastructure, making a specific server name quickly outdated information.
How many total test runs go into a typical review?
A full provider review typically involves at minimum 45 individual test runs — three distance tiers, three time-of-day windows, and five repetitions each — before we even get to the practical streaming, gaming, and download tests layered on top.
What happens if a provider’s performance changes after you publish?
We re-test on a rolling basis and update published figures when we identify a meaningful, sustained change, rather than leaving outdated numbers live indefinitely.
Why We Publish “Percent of Baseline” Instead of Raw Megabits
It bears repeating because it’s the single most common point of confusion we hear from readers: a raw megabit number from any review site is only meaningful if you know the exact baseline connection it was measured against, which most sites don’t clearly disclose. A provider that “achieved 450 Mbps” sounds impressive until you learn the baseline connection was a 500 Mbps line — a 90% retention rate. The same provider quoted from a 1 Gbps baseline connection achieving 450 Mbps would represent a much less impressive 45% retention rate. We standardize on percentage of baseline specifically to strip out this ambiguity and let you compare figures meaningfully regardless of what internet plan you personally have at home.
Reading Our Reviews Critically
We’d rather you treat any published speed figures, including our own, as directional guidance rather than a guarantee. The most reliable test is always the one you run yourself, on your own connection, during the hours you actually plan to use the service. Most reputable providers offer a free trial or money-back guarantee window specifically so you can do exactly that before committing long-term.
Closing Thoughts
Good methodology isn’t glamorous, but it’s the difference between a genuinely useful review and marketing dressed up as journalism. We publish this breakdown so you can hold our own reviews to the same standard we apply to the providers we test — and so you know exactly what’s behind every number you read on Tedony.
Methodology documented by the Tedony Team. We welcome scrutiny of our process and update this page whenever our testing approach evolves.